2013年6月21日 星期五

Answers to the take-home final examination of an English course

Answers to the take-home final examination of an English course:


Ø   子句分為名詞子句、形容詞子句、副詞子句
n   名詞子句:

(1)   that S+V-例句:This is something that he loves.

(2)   what S+V-例句:What she said doesn’t really matter.

(3)   how S+V -例句:I don’t know how he came here.

n   形容詞子句:

(1)關係詞+動詞  例句:The man who lives next to us is a teacher.

(2)關係詞+主詞+動詞  例句:The boy whom my mom talked to is one of my cousin.

n   副詞子句

(1)   連接詞+ 主詞+動詞 , 主詞+動詞-例句:No matter where you go, I go with you.

(2)   主詞+動詞, 連接詞+主詞+動詞-例句:He gets high grades in English exam, because he always spends lots of time studying and practicing.

Ø   主詞有哪四種?並舉出例句。

一般句子最少要有(主詞+動詞),主詞有:

1.          名詞當主詞-例句:Taiwan is a beautiful island.

2.          代名詞當主詞-例句:They are my good friends.

3.          動名詞當主詞-例句:Seeing is believing.

4.          不定詞當主詞-例句:To visit Europe is his dream.

Ø   不定詞的用法有哪五種?

1.          不定詞當主詞-例句:To learn English is not easy.

2.          不定詞當受詞-例句:Tom wants to study English every day.

3.          不定詞當補語-例句:She is to go abroad tomorrow.

4.          不定詞當形容詞片語-例句:Tim needs a boy to play with.

5.          不定詞當副詞片語-例句:He slowed down to wait for his children.

Details of English-Chinese Translation Service by Clyde Studio (in Chinese):


Details of English-Chinese Translation Service by Clyde Studio (translated by our translation app)


Clyde Studio(克萊德工作室)
English-Chinese Translation Service & Development of iPhone,Android Apps
facebook Page: 克萊德工作室
E-mail: clydechu@yahoo.com.tw
    clydechu0@gmail.com
Support website in Traditional Chinese: http://tw.myblog.yahoo.com/clydechu
Support website in Simplified Chinese: http://blog.sina.com.cn/clydechu
Support website in English: http://clydestudio.blogspot.com/

2013年6月15日 星期六

English to Chinese Translation Work (June 16th, 2013)

Excerpts from a recent work:

The United States dropped two atomic bombs on Japan in order to bring WWII to an end.
為了結束二次大戰美國在日本投下兩顆原子彈。
The bomber’s bombing of the bridge was a horrible act.
炸彈客炸了那座橋真是一件恐怖的舉動。
Hopefully the bomb won’t explode in your face.
但願炸彈不會在你面對爆炸。
Spiders are the insects that I hate the most.
蜘蛛是我最討厭的昆蟲。
The exterminator use insecticide to exterminate all the bugs in the house.
除蟲工人使用殺蟲劑以殺除屋內所有昆蟲。
Every month a maintenance person comes to maintain the elevators in the building.
每月一保養人員來保養建築物裏的電梯。
After they went into debt, they tried to maintain the business by selling off certain assets.
在他們負債之後,他們試著賣出一些資產以維持生意。
Keep taking the medicine if you want to maintain your health.
如果你想要維持你的健康就要持續服藥。
The students are anxious to get the results of their test.
學生們急於知道他們的測試結果。
The students anxiously waited for the results.
學生們焦急地等待結果。
Florence gets anxious whenever he has to talk in front of a large group of people.
佛羅倫斯只要必須在一大群人面前說話時就感到焦慮。
The size of the classroom is six meters by seven meters.
教室的大小為六公尺乘七公尺。
If you think it’s acceptable for him to miss so many days of school then I will accept your decision.
如果您覺得他這麼多天沒來上學是可接受的,那麼我就接受您的決定。
Course credits from Jason’s old school were not accepted at his new school.
傑森在舊學校的課程學分不被他的新學校所接受。
The product was not well accepted by the Indian market.
此產品在印度市場的接受度不高。
Jacques’s parents feel that not passing middle school exam is unacceptable.
賈克的雙親覺得沒通過中學校考試是不能接受的。
His acceptance of the business plan depends on how much money he thinks he can make from it.
他是否接受此商業計劃書取決於他認為他可由此賺到多少錢。
The economist said that the economic situation of the nation’s economy is in trouble.
此經濟學者表示此國家的經濟形勢正陷入困境。
The economist will make predictions about the economy.
此經濟學者會對經濟作出預測。
Claude studied economics in college.
克勞德大學時讀的是經濟學。

The count of our Chinese-English sentence pairs in our dictionary database reaches 50,000 at the moment.  The number keeps increasing and we always welcome your donation of Chinese-English sentence pairs by E-mails or messages on our facebook Page '克萊德工作室'.

Details of English-Chinese Translation Service by Clyde Studio (in Chinese):


Details of English-Chinese Translation Service by Clyde Studio (translated by our translation app)


Clyde Studio(克萊德工作室)
English-Chinese Translation Service & Development of iPhone,Android Apps
facebook Page: 克萊德工作室
E-mail: clydechu@yahoo.com.tw
    clydechu0@gmail.com
Support website in Traditional Chinese: http://tw.myblog.yahoo.com/clydechu
Support website in Simplified Chinese: http://blog.sina.com.cn/clydechu
Support website in English: http://clydestudio.blogspot.com/

2013年1月10日 星期四

Update: What’s New in RDHx Toolbox v1.1 (iOS App)

RDHx Toolbox - Clyde Studio
New features are now avaiable in RDHx Toolbox v1.1 as follows.
  
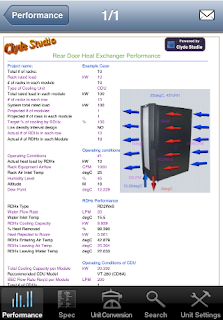
1. Add a new 'Performance' view as the first item of tabbars. Inside such 'Performance' view, users can change the parameters of operating conditions including the room temp and %RH, rack rated heat load, air flow rate, RDHx type, water flow rate, and entering water temp. With a tap on the texts or arrows, users will enter a subview in which they can select a new operating condition from the pickerview.
 

2. Add two buttons to the right of the navigation bar of the 'Performance' view. The first button is for the generation of a report in PDF format. The PDF file contains all operating parameters of such Rear Door Heat Exchanger under the condition currently specified. Users can send the resulting PDF file out by e-mail with a tap on the 'E-mail' button to the right of the navigation bar of this 'PDF' view. On the other hand, users can save the screenshot of 'Performance' view to the 'album of saved photos' by a tap on the second button of the navigation bar of the 'Performance' view.
 
3. Minor improvement on the 'Unit Conversion' view to remove trailing zeros after conversion.  

4. Add a few new RDHx models to the 'Spec' view. 

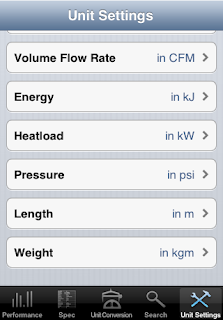
5. Add a new 'Unit Settings' view as the last item of tabbars. Users can change the units to the preferred ones from here.

 6. Add support for iPhone 5

2012年11月4日 星期日

Update: What’s New in QuickPipe v1.1

New features are now avaiable in QuickPipe v1.1 as follows.
QuickPipe - Clyde Studio

1. Add response to Tap Gesture on several Labels of titles. Users can simply tap the labels of ‘Chemical Composition’, ‘Name of Fluid’, and ‘Index of Fluid’ to enter a new selection view. In this new Fluid Selection view, there is a column with a list of all properties of current fluid selection and a PickerView underneath the list column. The users can quickly pick the target fluid in the PickerView and check the properties of the current selection immediately.

2. On the page of ‘Pipe Spec’, users can tap the labels of ‘Name of Pipe’, ‘Class of Pipe’, and ‘Index of Metal Tube’ or ‘Index of Plastic Pipe’ to enter a new selection view. In this new Tube/Pipe Selection view, there is a column with a list of all properties of current Tube/Pipe Selection and a PickerView underneath the list column. The users can quickly pick the target metal tube or plastic pipe in the PickerView and check the properties of the current selection immediately.


3. On the page of 'Pressure Loss of Water', users can tap the labels of ‘Name of Tube/Pipe/Hose’, ‘Nominal Size’, and ‘Index of Metal Tube/Plastic Pipe/Hose’ to enter a quick selection view.


4. On the page of ‘Pressure Loss of Water’, the above-mentioned new function applies to the selection of Hoses as well.

5. On the page of 'Pressure Loss of Water', add response to Tap Gesture on 'Rec. Max Flow Rate' allowing users to pick value of the 'Current Recommd Max Velocity' they prefer to use. Both imperial unit in ft/s and SI unit in m/s are available for selection by a tap on the unit itself. (Note: The recommended max fluid velocity is 8.0ft/sec as per ‘Copper Tube Handbook” and 3.0m/sec as per ‘Copper Tube in Buildings’.


6. Add response to Tap Gesture on all Labels of units. The views of unit setting with the corresponding unit type will appear for a quick selection.


7. On the page of 'Overall Pressure Loss', users can tap the label of ‘Current Selection Size’ to enter a quick selection view. In this quick selection view, the users can pick Metal Tube, Plastic Pipe, or Hose from the top PickerView and then pick the exact type/class from the bottom PickerView.


8. On the page of 'Overall Pressure Loss', add a floating Label to show the value of current flow rate.

9. On the page of 'Overall Pressure Loss', users can tap the labels of ‘# Standard Ell 90°’, ‘# Standard Ell 45°’, ‘# 90° Tee (Side Branch)’, ‘90° Tee (Straight Run)’, and ‘ # Coupling’ to enter a new view of the Pressure Loss in Fittings Expressed as Equivalent Ft of Tube for the current selection size. This way the users can easily check and modify the values of the equivalent ft of current selection size. A new view of the Pressure Loss in Valves Expressed as Equivalent ft of Tube will show up when the users tap the labels of ‘# Ball Valves’, ‘# Gate Valves’, ‘#Butterfly Valves’, and ‘# Check Valves’.

2012年7月27日 星期五

What is GetCurve and what can it do for you? (iOS App Store)

Search Keywords on iPhone App Store: “GetCurve“, “Curve Fitting“, “Polynomial “

As mentioned in the Release Note, GetCurve is an excellent tool to extract information from an existing chart. It will convert the point coordinates from the chart and even perform curve fitting to obtain a best polynomial to describe the curve passing through all the input points.

Here we will further show you some examples on how to perform such task with GetCurve.
Firstly, here is an article on United States congressional apportionment on Wikipedia. There is a chart which represents “Population per U.S. Representative allocated to each of the 50 states and DC, ranked by population” in the Reapportionment Section.

This a typical bar chart and we will take it as an example to show you how GetCurve can help you acquire the numbers inside.

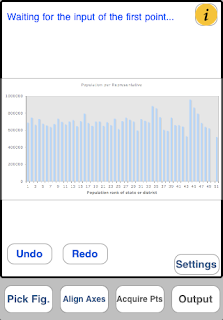
Whenever you see a chart on any document, on the projection screen or on your laptop, you can take a picture by your iPhone/iPad/iPod devices. When you start GetCurve, you will see four buttons to the lower portion of it. As prompted by GetCurve, please start the App by selecting “Pick Fig.”. You can either select the photo you just took from the camera roll or select any photo from the photo library.

After that, the selected chart will be shown on the center of the screen and the “Align Axes” button will be flicking. Now we can move forward by tapping the “Align Axes” button.

As explained by the description and the illustration, now we need two points on the X axis and another two points on the Y axis to construct the coordinate system.

After “Proceed” button pressed, the App will prompt the message that it is waiting for the input of four points with the order specified.

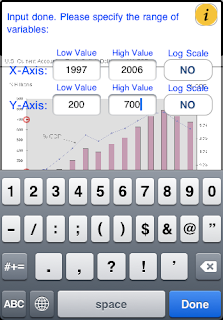
After the completion of input of four points, GetCurve needs to know the real high and low values of the X and Y axes. This is a necessary step for the conversion between the screen coordinates and real coordinates. If either or both X and Y axes are of log scale, please simply tap the Log Scale buttons to “YES”. GetCurve will automatic convert the X and Y coordinates by logarithmic calculation.
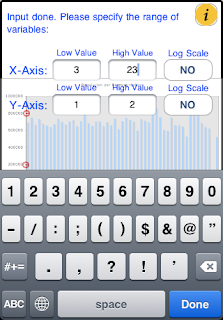
 

Here is a screenshot of the complete of all high and low values of this specific chart.


After that, we can move on by tapping “Acquire Pts” button. Another description and the associated illustration will be shown on the screen, this step is simply the input of any number of points which portray a specific curve on the chart.

Here we start from the very first point on the X axis. Immediately after we input a new point, we will see the real (X, Y) coordinates shown on the screen. For example, the Population Per Representative will be ‘728375’ when the Population Rank of State or District is ‘3’.

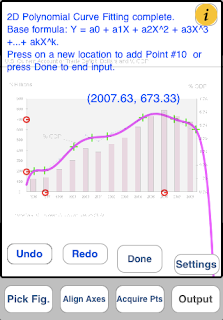
As we continue to input more points, GetCurve will start the polynomial curve fitting at the same time and the resulting fitting curve will be shown as well.

As the nature of polynomial curve fitting, the complexity of input points will eventually cause the polynomial fitting to fail. Under such case, we strongly recommend to divide the overall X span to several sections so that each section can be represented by a single fitting curve. For our example here, the first section stops at X=31. Therefore, we obtain a fitting curve which portrays the Population Rank from 1 to 31.

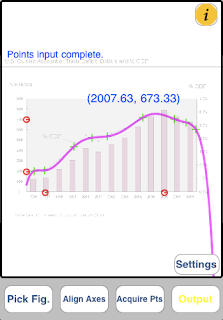
When you press “Done” button, the “Output” button will be flicking to note you that the calculations are all complete.
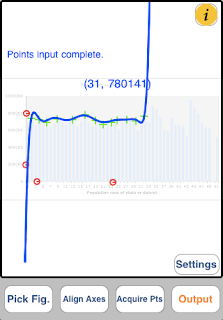

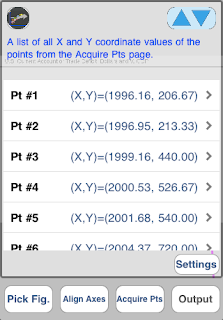
As you press “Output” button, you will first see a list of all X and Y coordinate values of the points from the Acquire Pts Page.

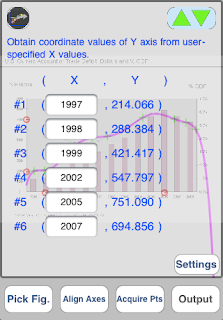
As you press the top right button with up and down triangles, the second page will be shown which includes several text fields for user input. As you input a new value in any one of the text fields as the real X value, the corresponding Y value will immediately be shown to the right of the text field.

There is no limit on the X value and of course the Y value is based on the calculation of the resulting polynomial and the value may be unreasonable when the input is out of range.

As you press the top right button again, the third page with the function of output text file and email generation will be shown. Three file types are available to fulfill you with such need.
1.    Tab-separated values
2.    Comma-separated values
3.    Space-delimited text

An option is also provided that the resulting curve-fitting formula and coefficients can be included in such text file as well.
Whenever you press the icon on the top left of the screen, this will reduce the Alpha value of the current output page. You can double check all the Acquire Pts and the resulting fitting curve.

An example of the email to be sent is shown below.

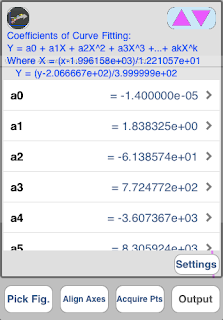
As you press the top right button again, the fourth page with the coefficients of Curve Fitting is shown. This is for your reference and all the values can be included in the text file as the email attachment as the “Incl Curve Fitting Coeffs.” Button is checked.


So far we’ve went through all major functions provided by GetCurve, Should you prefer to personalize the operation of GetCurve, we also provide a “Settings” button which let you change certain setting of GetCurve. The parameters include Fitting Line Width, Circle Mark Radius, System Text Color. Just to name a few of them.


A second chart of ‘United States Population per Representative’ in the Section of ‘Controversy and history’ serves as our second example. Please kindly follow the same steps described above.


The screenshot below shows the low and high valves of X and Y axes in the ‘Align Axes’ page.

When in ‘Acquire Pts’ page, we use eight points to describe this chart. As shown below, the resulting curve portrays the bar chart quite well.


More screenshots of the output pages are as below. We can easily acquire the corresponding population on the year of 1950, 1960, 1970, 1980 and etc.
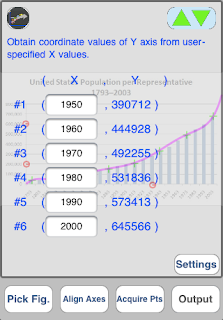

Example #2:
Here we have another example with a more complex curve in an article discussing the ‘2007–2012 global financial crisis’.

In the section of ‘Background’, we found a chart of ‘GDP Share of U.S. Financial Industry’. Let’s see how GetCurve can help you acquire the point information from this chart.
A screenshot of our inputs in the ‘Align Axes’ page is shown as below.


Starting from the year of 1860, we specified ten points in the ‘Acquire Pts’ page to portray the curve until the year of 1873.

This is the list of all X and Y values.

We can now easily acquire the corresponding GDP share on the year of 1870, 1880, 1890, 1900 and etc.

This screenshot shows the coefficients of the polynomial curve fitting.
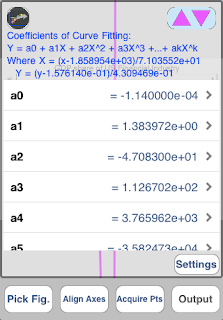

Next let’s perform similar analysis on the chart of ‘U.S. Subprime Lending Expanded Significantly 2004-2006’ in the section of ‘Subprime Lending’.

A screenshot of our inputs in the ‘Align Axes’ page is shown as below.

Starting from the year of 1997, we specified ten points in the ‘Acquire Pts’ page to portray the curve until the year of 2003.

This screenshot shows the coefficients of the polynomial curve fitting.

We can now easily acquire the corresponding Subprime Share on the year of 1997, 1998, 1999, 2000, 2001 and etc.

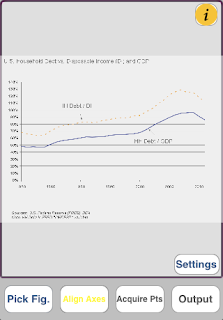
By applying similar procedures, we obtain the results on the chart of ‘U.S. Household Debt vs. Disposable Income (DI) and GDP’ as below.


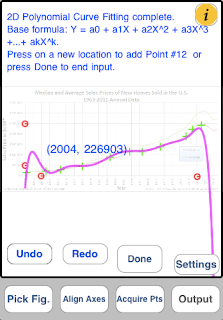
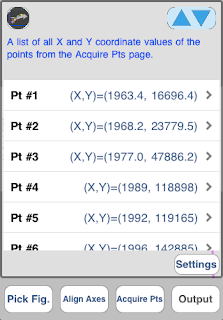
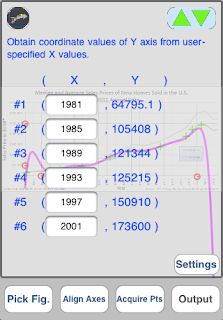
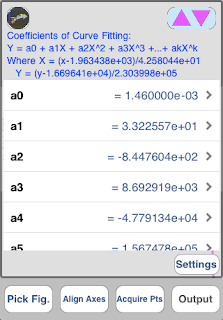
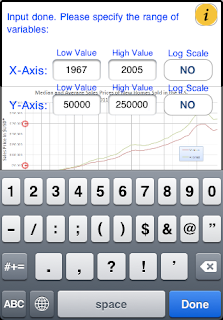
 More results on the chart of ‘Median and Average Sales Prices of New Homes Sold in the U.S.’.


No problem to perform curve fitting on the chart of ‘U.S. Current Account or Trade Deficit: Dollars and % GDP’.
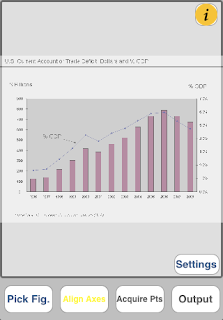


In short, whether it's a column chart, bar chart, line chart or XY scatter chart, GetCurve can always help you extract the numbers back. With GetCurve, you will never be afraid of the cumbersome logarithmic conversions because of the log scale on the X or Y or both axes. GetCurve will take care of all the complex calculations for you.